HSR_Software
Software for Hyperspectral Super-Resolution with Coupled Tucker Approximation
Copyright (c) 2019 Clémence Prévost, Konstantin Usevich, Pierre Comon, David Brie
Contact: clemence.prevost@univ-lorraine.fr
This MATLAB software reproduces the results from the following article:
@article{prevost2020hyperspectral,
  title={Hyperspectral super-resolution with coupled Tucker approximation: Recoverability and SVD-based algorithms},
  author={Pr{\'e}vost, Cl{\'e}mence and Usevich, Konstantin and Comon, Pierre and Brie, David},
  journal={IEEE Transactions on Signal Processing},
  volume={68},
  pages={931--946},
  year={2020},
  publisher={IEEE}
}
Content
- demo.m: demo file with minimal requirements
- /demos : contains demo files that produce tables and figures (including
main.m -
/data : contains data for synthetic examples (Section VI.D)
- /figures : where the tables and figures are saved
- /images : contains illustrative figures for this
README.md - /src : contains helpful files to run the demos
Minimal requirements
In order to run the demo file demo.m, you will need to:
- Download and install Tensorlab 3.0: https://www.tensorlab.net
- Download some hyperspectral data from http://www.ehu.eus/ccwintco/index.php/Hyperspectral_Remote_Sensing_Scenes and load them into MATLAB
Full requirements
In addition, in order to run the demo file demos/main.m, you will need to:
- Download codes by C. Kanatsoulis from https://github.com/marhar19/HSR_via_tensor_decomposition and add them to your MATLAB path
- Download codes for HySure from https://github.com/alfaiate/HySure and add them to your MATLAB path
- Download codes for FUSE from https://github.com/qw245/BlindFuse and add them to your MATLAB path
## Demo file
A demo with minimal requirements is available. To proceed, please run the demo.m file.
### Load hyperspectral data
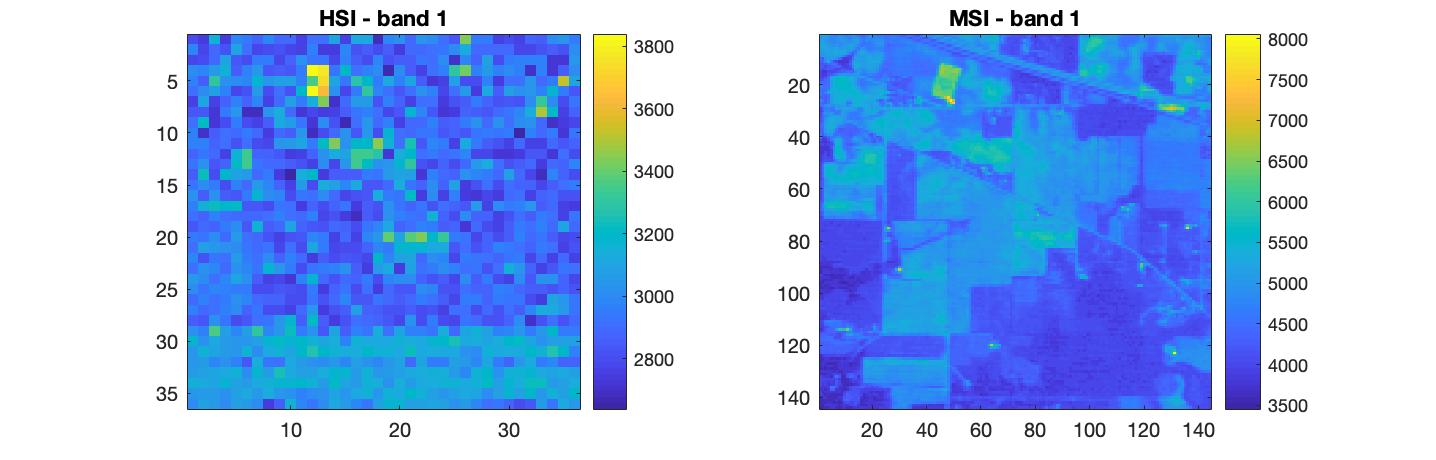
Start by loading hyperspectral data. This parts manually generates the HSI and MSI from the groundtruth SRI, by computing the degradation matrices.
Below is an example of a single spectral band for the HSI and MSI from the Indian Pines dataset.
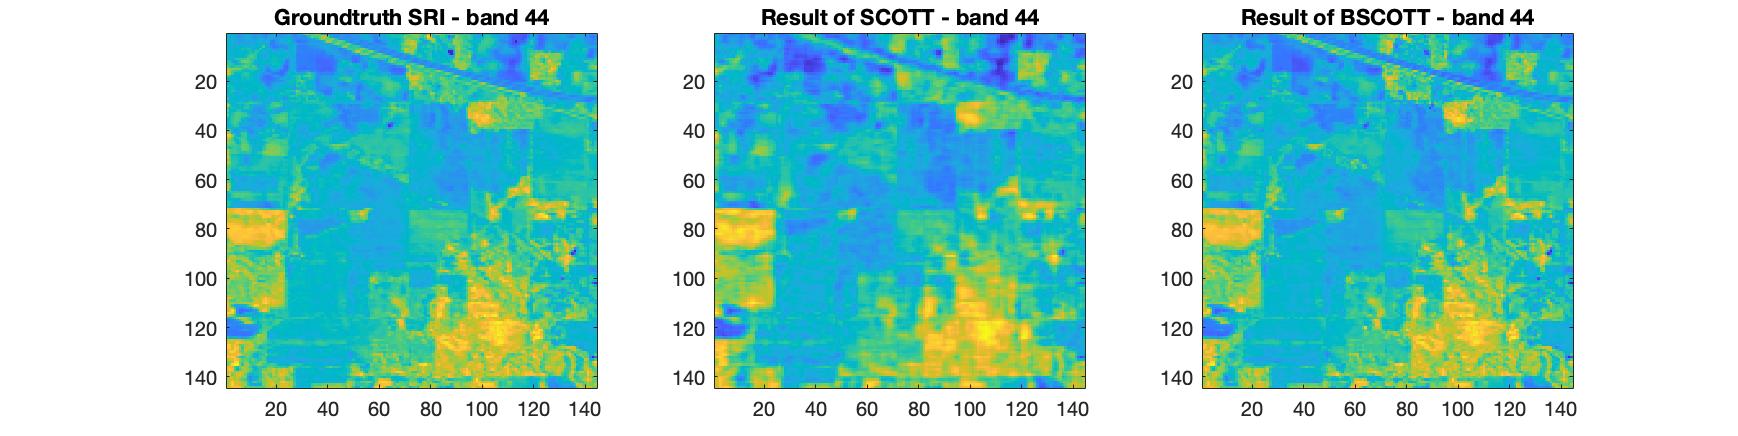
### Run algorithms
The next step is to run the algorithms SCOTT and BSCOTT (Blind-SCOTT).
 R = [40 40 6];
 [SRI_hat1, ~] = scott2(HSI, MSI, P1, P2, Pm, R);
 opts.Nblocks = [4 4];
 [SRI_hat2, ~] = bscott(MSI,HSI,Pm,R,opts);
The algorithms return the estimated SRI of given multilinear rank R. For BSCOTT, the HSI and MSI are split into corresponding opts.Nblocks blocks along the spatial dimensions. Note that BSCOTT does not require the knowledge of P1 and P2.
### Comparison metrics
You can then generate a table of comparison metrics and computation time:
| Algorithm | R-SNR | CC | SAM | ERGAS | Time (s) |
|---|---|---|---|---|---|
| SCOTT | 26.3908 | 0.887454 | 2.32401 | 1.0587 | 0.26491 |
| BSCOTT | 18.647 | 0.820201 | 4.27434 | 2.62442 | 0.1644 |
Reproduce figures and tables from the paper
To do so, you need to run the demos/main.m file.
Here, a menu is available and allows you to choose which figure or table you want to generate.
Each number in the table below corresponds to a set of figures, and/or tables.
| Number | Content |
|---|---|
| 1 | produces Tables I and II and Figures 3 and 4 |
| 2 | produces Tables III and IV and Figures 5 and 6 |
| 3 | produces Table V |
| 4 | produces Figures 7 and 8 |
| 5 | produces Figures 9 and 10 |
| 6 | produces Figure 11 |
| 7 | produces Figure 12 |
| 8 | produces Figures 13 and 14 |
| 9 | produces Figures 15 and 16 |
| 10 | produces Figures 17 and 18 |
| 11 | produces Figures 20, 21 and 22 |